
Stochastic oscillator is a valuable tool for technical trading analysis. That is why traders often use stochastic together with numerous unrelated indicators. We recommend using two stochastic indicators together for better and more consistent results. One stochastic by itself doesn’t seem to yield eye-popping gains.
The good news is that a dual stochastic trading system can produce excellent results. A winning strategy can be built simply based on dual stochastic indicators: one slow, and the other fast – in order to find trading opportunities.
What is a stochastic oscillator?
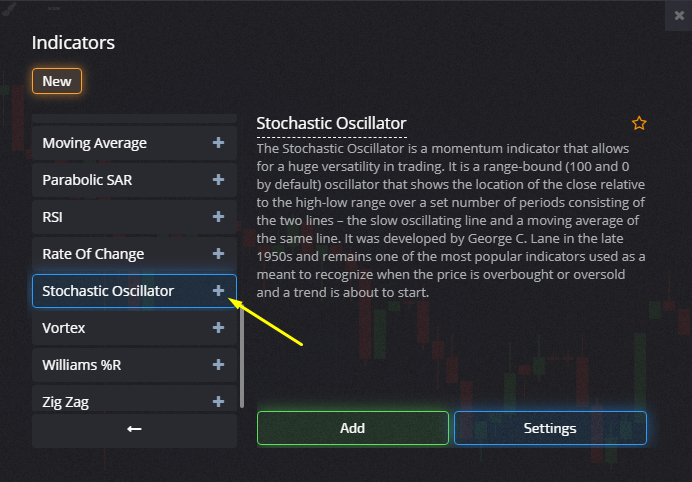
The Stochastic Oscillator compares where a asset’s price closed relative to its price range over a given time period. It is included in the set of standard indicators in most trading terminals, including Pocket Option.
Stochastic is usually located under the price chart. It is a set of horizontal levels, as well as 2 signal lines moving within the range.
The fast signal line is more sensitive to price changes and indicates market trend. The slow line is used to confirm the signal.
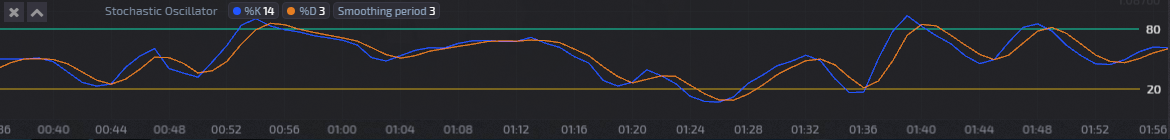
Levels 0 and 20 form the oversold zone. If both lines are in this zone, it means that most sellers are active in the market.
Levels 80 and 100 form an overbought zone. . If both lines are in this zone, it indicates that most buyers are active in the market.
The standard settings for the indicator are as follows: period% K (slow) = 14; period% D (fast) = 3; deceleration = 3.
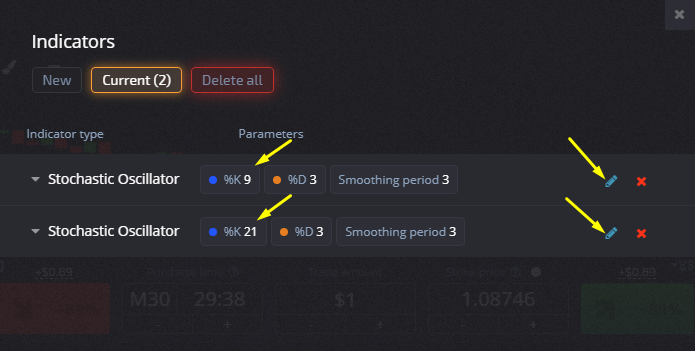
You can change the parameters for the Stochastic depending on your strategy.
The Trading Signals
Stochastic Oscillator generates accurate signals and is easy to understand. It does not require deep market knowledge.
The main signals of Stochastic include the following:
- Lines in the “over” zones. If both lines are in the oversold zone (from 0 to 20), and the fast line crosses level 20 from bottom to top, then after closing the current candle, you should buy a Call contract. If the lines are in the overbought zone, and the blue line begins to cross the level 80 from top to bottom, then you should buy a Put contract.
- The intersection of the lines. You can see left and right intersections when a fast line crosses a slow one. Is the crossing is from bottom to top, buy the Call option, and if from top to bottom, buy Put.
- The direction of the lines. Some traders rely on the direction of the lines. However, we consider such signals unreliable.
Basic Tips for the Dual Stochastic Strategy
It is one of the most popular and simplest strategies to execute. For analysis, you will need 2 stochastic indicators. The first (fast) will have parameters (9; 3; 3), and in the second (slow) will have parameters (21; 9; 9).
The analysis should be carried out on a 15-minute time frame to eliminate market noise. The expiration period should be from 45 minutes to 1 hour.
To purchase a contract, the following conditions must be met:
- Buy Call when the lines on both stochastic indicators are in the oversold zone, and the line moves from the bottom up.

- Buy Put when the lines on both stochastic indicators are in the overbought zone, and the signal line crosses the slow one from top to bottom.

As you can see, the Dual Stochastic Strategy is an effective trend seeking strategy, which helps trader stick to the market trends – the only way to profit substantially. Nonetheless, as we already know, there’s no indicator that could guarantee 100% winning signals, even the most well developed ones. You need to understand it and test it before you apply it.


