
The Williams %R is similar to the Stochastic oscillator and is used in the same way. Conversely, the Fast Stochastic Oscillator, which moves between 0 and 100, illustrates a market’s close about the lowest low. The Williams %R corrects for this by multiplying by -100. Some experts say that the Williams %R and the Fast Stochastic Oscillator end up being almost the same indicator. The only difference between the two is how the indicators are scaled.
Larry Williams developed it to compare closing prices to the high-low range over a specific period. Traders traditionally apply 14 days or periods to monitor and determine the trend reversal in financial markets. Despite the abundance of analytic tool and instruments, traders prefer the good old %R oscillator. Other instruments include indicators and oscillators such as Stochastic, RSI, CCI in binary options trading.
Experienced traders know-how set up and use Williams %R oscillator in their trading terminal of the Pocket Option. It is efficient and accurate however traders need to learn about its limitations. The indicator can also be too responsive and generate false signals.
About the % R Oscillator: How to set and use?
Larry Williams revealed the %R indicator in his book “How I Made One Million Dollars” in 1973. He used the momentum indicator to trade stocks, futures, currencies, and commodities since 1966. Williams Percent Range gained popularity overnight because its inventor made incredible 11,000% returns on the stock market. Who would not want it? He created the oscillator specifically for the securities market but later adapted to other assets.
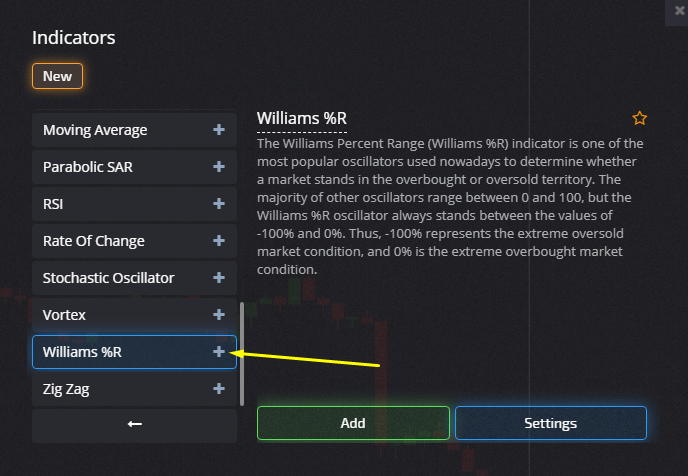
Traditionally, the Williams %R is displayed under the price chart. You can see levels 0, -20, -80 and -100 and a signal line moving up and down. If you are used to the Stochastic, at first it will look upside down. The Williams per cent range indicator provides us with valuable information about the strength or weakness of a trend of a stock, commodity, currency pair, cryptocurrency or any other financial instrument that has attached to it a price.

The oversold zone is between the levels of -80 and -100.
The overbought zone is between 0 and -12.
It is recommended the periods from M30 to H4 or 14 candles.

How to trade options using Williams % R?
The Williams percent range indicator is a powerful indicator that can help you day trade any market in the world. It is used in various capacities to determine reversals, overbought or oversold, the strength of the trend and signals to buy or sell.
The Williams Percent Range works great for high volatility assets like EUR/USD, GBP/USD or cryptocurrencies.
The recommended steps are as follows:
- CALL contract when the signal line leaves the oversold zone or crosses the -80 level from bottom to top;

- PUT contract when the signal line leaves the overbought zone or crosses the -20 level from top to bottom.

The expiration period should be more than the formation time of 3 candles.
Also, some traders use Williams Percent Range to see divergence. To see it you need to pinpoint when the peak prices on the chart are opposite the oscillator. The contract is bought in the direction of the trend.

The Pocket Option Broker offers traders a wide variety of tools. Momentum trading can offer great opportunities and the Williams %R trading strategy can help you. This means that you don’t need to wait for the market turn to develop, but you can get involved in the market right from the beginning of a rally or a selloff. The shift in momentum indicates that you can start looking for trade opportunities in the direction the oscillator crossed the -50 level. You can use it for making better and more informed decisions.


